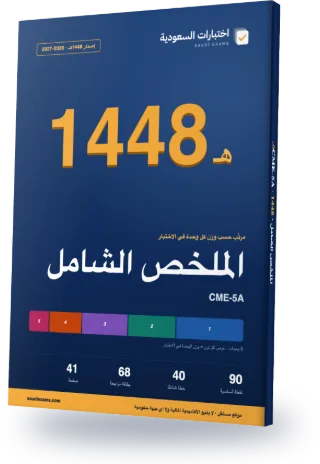
CME-5A Complete Review Guide 2026–2027
Every exam topic in a 41-page Arabic PDF, ordered from the heaviest unit to the lightest. The first three chapters alone cover about 74% of the exam questions.
- 41Pages
- 90Key points
- 40Common mistakes
- 68Flashcards
Guide map
Each chapter is one exam unit, ordered by its weight in the real exam.
| Chapter | Unit | Weight | Exam questions | Key points |
|---|---|---|---|---|
| 1 | Quantitative Analysis for Corporate Finance | 30% | 15 | 18 |
| 2 | Capital Structure | 22% | 11 | 18 |
| 3 | Corporate Transactions | 22% | 11 | 18 |
| 4 | Business Valuations | 16% | 8 | 18 |
| 5 | Corporate Finance Documentation | 10% | 5 | 18 |
Chapter 1 in full: Quantitative Analysis for Corporate Finance
30% of the exam, about 15 questions. These are its key points, as in the guide.
- (Indicator 1.1.1) Companies prepare accounts under the applicable standards: IFRS (issued by the IASB) for most quoted companies and US GAAP for companies quoted in the US. Standards make accounts comparable on a like-for-like basis with minimal distortion. Quoted companies publish audited annual accounts and unaudited interim statements (quarterly or half-yearly); private companies face lighter requirements depending on size.
- (Indicator 1.1.2) Control normally means more than 50% ownership, so a subsidiary is consolidated at 100%. The non-controlling interest (NCI, or minority interest) is the outsiders' share. Example: with 90% of a company earning 50,000, NCI = 10% × 50,000 = 5,000. An associate (20% to 49.9% with significant influence) is included in proportion to the holding, so a 25% stake brings in 25% of net assets and profit. A joint venture is accounted for under the equity method.
- (Indicator 1.2.1) The statement of financial position (balance sheet) is a snapshot at a date, with five main items: non-current assets, current assets, current liabilities, non-current liabilities, and capital and reserves. Net assets = total assets − total liabilities = total equity. Inventory is valued at the lower of cost and net realisable value; receivables are shown net of the provision for doubtful debts. Net current assets = current assets − current liabilities. Revenue reserves are distributable; capital reserves (such as the revaluation reserve) are not.
The rest of chapter 1, on this page
- (Indicator 1.3.1) The income statement (under IAS 1) runs: revenue − cost of sales = gross profit; − operating expenses = trading profit; ± share of associates' results = operating profit (EBIT); + finance income − finance costs = profit before tax; − tax = profit for the year, split between parent shareholders and the NCI. It is shown as one statement or two, and revenue is recognised at the point of sale, not when cash is received.
- (Indicator 1.3.2) Other comprehensive income (OCI) holds non-regular items: actuarial gains or losses on defined benefit pensions, asset revaluations and hedging gains or losses on financial instruments. Most are unrealised and can reverse, so they are normally excluded from ratios. Income from ordinary activities covers the regular revenue and costs.
- (Indicator 1.4.1) The statement of cash flows under IAS 7 shows cash in and out across three activities: operating (generating revenue and running costs), investing (buying and selling assets and acquisitions) and financing (loans, share issues, repayments and buybacks). The indirect method starts from operating profit and is the more common; the direct method shows cash received from customers and paid to suppliers. Under IAS 7, interest and dividends received or paid may be shown within operating, investing or financing, as the standard permits.
- (Indicator 1.4.4) Capital expenditure buys non-current assets (plant, buildings). It is not charged in full to the income statement; depreciation is charged over the asset's life, while the spending itself appears in the cash flow statement and raises assets. Revenue expenditure (raw materials, wages, rent, advertising, professional fees) appears in both the income statement and the cash flow statement.
- (Indicator 1.4.5) Depreciation spreads the cost of a tangible asset over its life; amortisation applies to intangibles such as patents and licences. Straight line = (cost − scrap value) / life. Example: plant costing 20,000 with scrap value 5,000 and a 10-year life gives (20,000 − 5,000) / 10 = 1,500 a year. The reducing balance method charges more in early years and the same total overall. Freehold land is not normally depreciated. Depreciation is a non-cash expense; the cash leaves when the asset is bought.
- (Indicator 1.4.2) Profit is not cash: revenue is recorded when invoiced, costs when incurred, and some expenses are non-cash (depreciation, amortisation, impairment). EBITDA = operating profit + depreciation + amortisation + impairment; example: 574.8 + 121.6 = 696.4. NOPAT = operating profit × (1 − tax rate); example: 100 × (1 − 19%) = 81. NOPAT applies tax to pre-interest profit, not the actual tax, which is reduced by interest relief. EBITDA is not an IFRS measure.
- (Indicator 1.4.2) Enterprise free cash flow = operating profit + non-cash items (i.e. EBITDA) − tax on operating cash flow − capital expenditure ± change in working capital, and is discounted at the weighted average cost of capital (WACC) to give enterprise value. Equity cash flow is after deducting interest (with its tax effect) and debt repayment and adding debt raised, but before dividends, and is discounted at the cost of equity. Increases in receivables or inventory reduce the flow; increases in payables raise it.
- (Indicator 1.4.3) CFADS (cash flow available for debt service) is calculated like enterprise free cash flow, with capital expenditure restricted to maintenance capex. Example: EBITDA less taxes, maintenance capex and working capital changes gives 900,000; total debt service (interest + principal) is 400,000; so debt service cover = 900,000 / 400,000 = 2.25x. Banks use it to gauge borrowing capacity, and a higher CFADS relative to debt service means more stability. It is not an accounting measure.
- (Indicator 1.5.1) Additional narrative reporting in the annual report: the chairman's statement, CEO and director reports, the strategic report (a fair review of the business and principal risks), the audit report (a true and fair view opinion, qualified if a clean opinion cannot be given), the directors' report (directors' names, activities and dividends), the remuneration report and the corporate governance report. ESG reporting follows the two ISSB standards: IFRS S1 for general requirements and IFRS S2 for climate-related disclosures. Statements are prepared on a going-concern basis.
- (Indicator 1.6.1) Profitability and liquidity ratios: gross profit margin = gross profit / revenue (1,008.7 / 3,453.7 = 29.2%). Operating profit margin = EBIT / revenue (574.8 / 3,453.7 = 16.6%). ROCE = EBIT / capital employed (non-current assets + net current assets); 574.8 / 959.4 = 59.9%. ROE = profit attributable to ordinary shareholders / shareholders' funds. Current ratio = current assets / current liabilities (1,067.3 / 832.9 = 1.28). Quick ratio = (current assets − inventory) / current liabilities (699.0 / 832.9 = 0.84, below 1).
- (Indicator 1.6.2) Gearing ratios: debt to equity = total interest-bearing debt / total equity (including NCI); 596.4 / 232.4 = 256.6%. Net debt to equity = (debt − cash) / equity; (596.4 − 49.3) / 232.4 = 235.4%. Net debt to EBITDA = (debt − cash) / EBITDA = 547.1 / 696.4 = 0.786, a guide to years needed to repay. Interest cover = EBIT / interest expense. These ratios often feed loan covenants, and higher gearing means higher risk.
- (Indicator 1.6.3) Earnings per share (EPS) = profit attributable to ordinary shareholders / weighted average number of shares; 401.1 / 180.7 = 222.0p. Diluted EPS (IAS 33) adds shares on full conversion and adjusts profit for the after-tax interest saved; example: profit 1,500,000 and 2,000,000 shares give EPS 75p; converting 700,000 of debt at 4 per share (175,000 shares) with 3% interest and 28% tax gives (1,500,000 + 15,120) / 2,175,000 = 69.66p, which must be reported because it is lower. P/E = share price / EPS; 2,250 / 222.0 = 10.14x (historic), and prospective P/E uses forecast EPS.
- (Indicator 1.6.3) Dividend yield = dividend per share / share price; 78 / 2,250 = 3.47%. Dividend cover = EPS / dividend per share = 222.0 / 78 = 2.85x (also profit attributable / total dividends). EV = market capitalisation + net debt: 4,162.5 + 596.4 − 49.3 = 4,709.6. EV/EBIT = 4,709.6 / 574.8 = 8.19x; EV/EBITDA = 4,709.6 / 696.4 = 6.76x. P/B = market capitalisation / net assets (or share price / net assets per share), common for real estate and banks. Holding period return HPR = ((P1 − P0) + cash flow) / P0.
- (Indicator 1.7.1) Risk is the possibility that actual returns differ from expected returns. Population variance σ² = Σ(x − μ)² / n, and standard deviation σ = √variance, in the same units as returns. Example: returns 16, −32, 18, 4, 6 with mean 2.4 and sum of squares 1,627.4 give variance = 1,627.4 / 5 = 325.5 and SD = 18.04%. For a sample divide by n−1: 1,627.4 / 4 = 407 and SD 20.17. The higher the SD, the higher the risk.
- (Indicator 1.7.2) The correlation coefficient (CORR) ranges from −1 to +1: +1 means identical movement, −1 exactly opposite, 0 no relationship. Covariance COV(A,B) = σA × σB × CORR(A,B) (or Σ(A − μA)(B − μB) / n for a population). Example: 0.14 × 0.12 × 0.81 = 0.0136, and 0.12 × 0.29 × (−0.05) = −0.0017. Positive covariance means movement in the same direction, negative the opposite. Diversification reduces portfolio risk when correlation is low or negative.
Common mistakes in this chapter
- Do not confuse total debt with net debt: net debt = debt less cash, and EV = market capitalisation + net debt.
- The quick ratio excludes inventory; the current ratio includes all current assets.
- ROCE uses operating profit (EBIT) over capital employed (non-current assets + net current assets); ROE uses profit attributable to ordinary shareholders over shareholders' funds.
- An increase in receivables or inventory reduces operating cash flow, while an increase in payables raises it; do not reverse the signs.
- Sample variance divides by n−1, not n; standard deviation is the square root of the variance.
- Capital expenditure is not in the income statement (depreciation is); it appears in the cash flow statement, whereas revenue expenditure appears in both.
- Dividends are not an expense in the income statement; they are deducted from distributable reserves.
- Low covariance does not mean low standard deviation: covariance = SD of first × SD of second × correlation, so a volatile asset with low correlation can reduce portfolio risk.
The other chapters are in the full guide
One purchase · lifetime access · review guide included
7-day review plan
The chapters are spread over 6 days by weight so each day carries a similar load. Day 7 is a full exam.
Day 1 · 30% of the exam
Chapter 1: Quantitative Analysis for Corporate Finance
Day 2 · 22% of the exam
Chapter 2: Capital Structure
Day 3 · 22% of the exam
Chapter 3: Corporate Transactions
Day 4 · 16% of the exam
Chapter 4: Business Valuations
Day 5 · 10% of the exam
Chapter 5: Corporate Finance Documentation
Day 6
Full mock exam: 50 questions in 60 minutes, then review the common mistakes in the units where you lost marks.
How many correct answers do you need?
- Pass mark 70%35 correct out of 50
Before you read: see your score today
10 free questions from the main units, no sign-up. Then you know which chapter to start with.
Try 10 free questions and see your levelA look at each chapter
The first three key points of each chapter, as they appear in the guide (in Arabic in the PDF).
Chapter 1: Quantitative Analysis for Corporate Finance
- (Indicator 1.1.1) Companies prepare accounts under the applicable standards: IFRS (issued by the IASB)…
- (Indicator 1.1.2) Control normally means more than 50% ownership, so a subsidiary is consolidated…
- (Indicator 1.2.1) The statement of financial position (balance sheet) is a snapshot at a…
Chapter 2: Capital Structure
- (Indicator 2.1.1) Capital structure is equity plus debt; ordinary shares are the last to…
- (Indicator 2.2.1) Ordinary shares are irredeemable; they carry a fixed nominal value unrelated to…
- (Indicator 2.2.1) Preference shares
Chapter 3: Corporate Transactions
- (Indicator 4.1.1) An acquisition is the purchase of a controlling interest in a private…
- (Indicator 4.1.1) Value of perpetual synergy = annual saving / discount rate. Example: savings…
- (Indicator 4.1.1) A disposal is the sale of a controlling interest. A trade sale…
Chapter 4: Business Valuations
- (Indicator 3.1.1) Enterprise value measures the total value of operating and non-operating assets regardless…
- (Indicator 3.1.2) Example
- (Indicator 3.1.1) Earnings-based (relative) valuation takes the multiples of similar companies in the sector…
Chapter 5: Corporate Finance Documentation
- (Indicator 5.1.1) NDA
- (Indicator 5.1.1) Engagement letter
- (Indicator 5.1.1) Representations, warranties and indemnities: the vendor confirms and promises the information is…
The full guide comes with lifetime access
The full guide (41 pages) is included with lifetime access to this exam, together with every question and full mock exam. Chapter 1 is free for everyone.
Questions about the guide
Is the guide free?
Chapter 1 is free to read on the guide page. The full guide comes with lifetime access to this exam; 7-day access does not include it.
Is it up to date for 2026–2027?
Yes. Unit weights and exam facts follow what the exam body last published, and the last check date is printed in the guide. If the standards change we update the file and buyers download the new version.
Does the guide have questions?
No. The guide covers key points and common mistakes; scoring, weak-area practice and full mock exams are on the site.
Can I read it on my phone?
Yes. A5 pages in a single column, with chapters linked from the contents.
- Pages
- 41
- Edition
- 1448 AH · 2026–2027
- Language
- Arabic
- Last updated
Full prep for this exam
All of this in one purchase.
- Full mock exam, same as the real one50 questions in 60 minutes. You get a total score and a score for every unit.
- Practice unit by unit560 questions, every option explained with its source. Starts with your weakest units.
- Complete Review Guide 2026–2027 (PDF)Ordered by each unit's weight in the exam. With lifetime access only.
Choose your access
Continue with your Google account and you go straight to the payment page.
You pay on the Waffo Pancake checkout page (in English). The amount is in US dollars and your bank converts it to riyals. One payment with no automatic renewal, by Visa, Mastercard (a mada card with either logo works too), Apple Pay or Google Pay. Your statement shows "WAFFO". Purchases are not refundable.